For the last few years I’ve had a go to grow various chilli and tomato plants for fun. You can’t grow these cheaper than you can buy them (or I can’t), but it’s fun and unrushable, which is a nice change from day to day tech.
Last year I built a timelapse rig that took a photo of the sky every second for an entire year. I’ve not got round to writing it up yet, but I learnt a lot about how to build a reasonably resilient setup using an old laptop and a security camera.
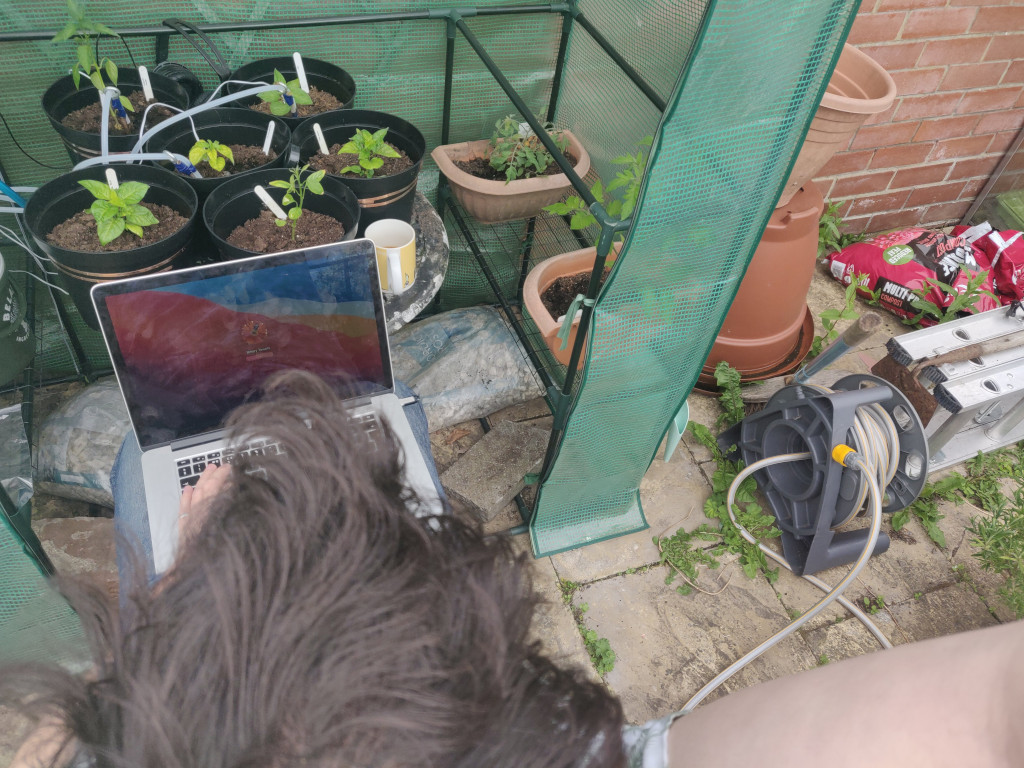
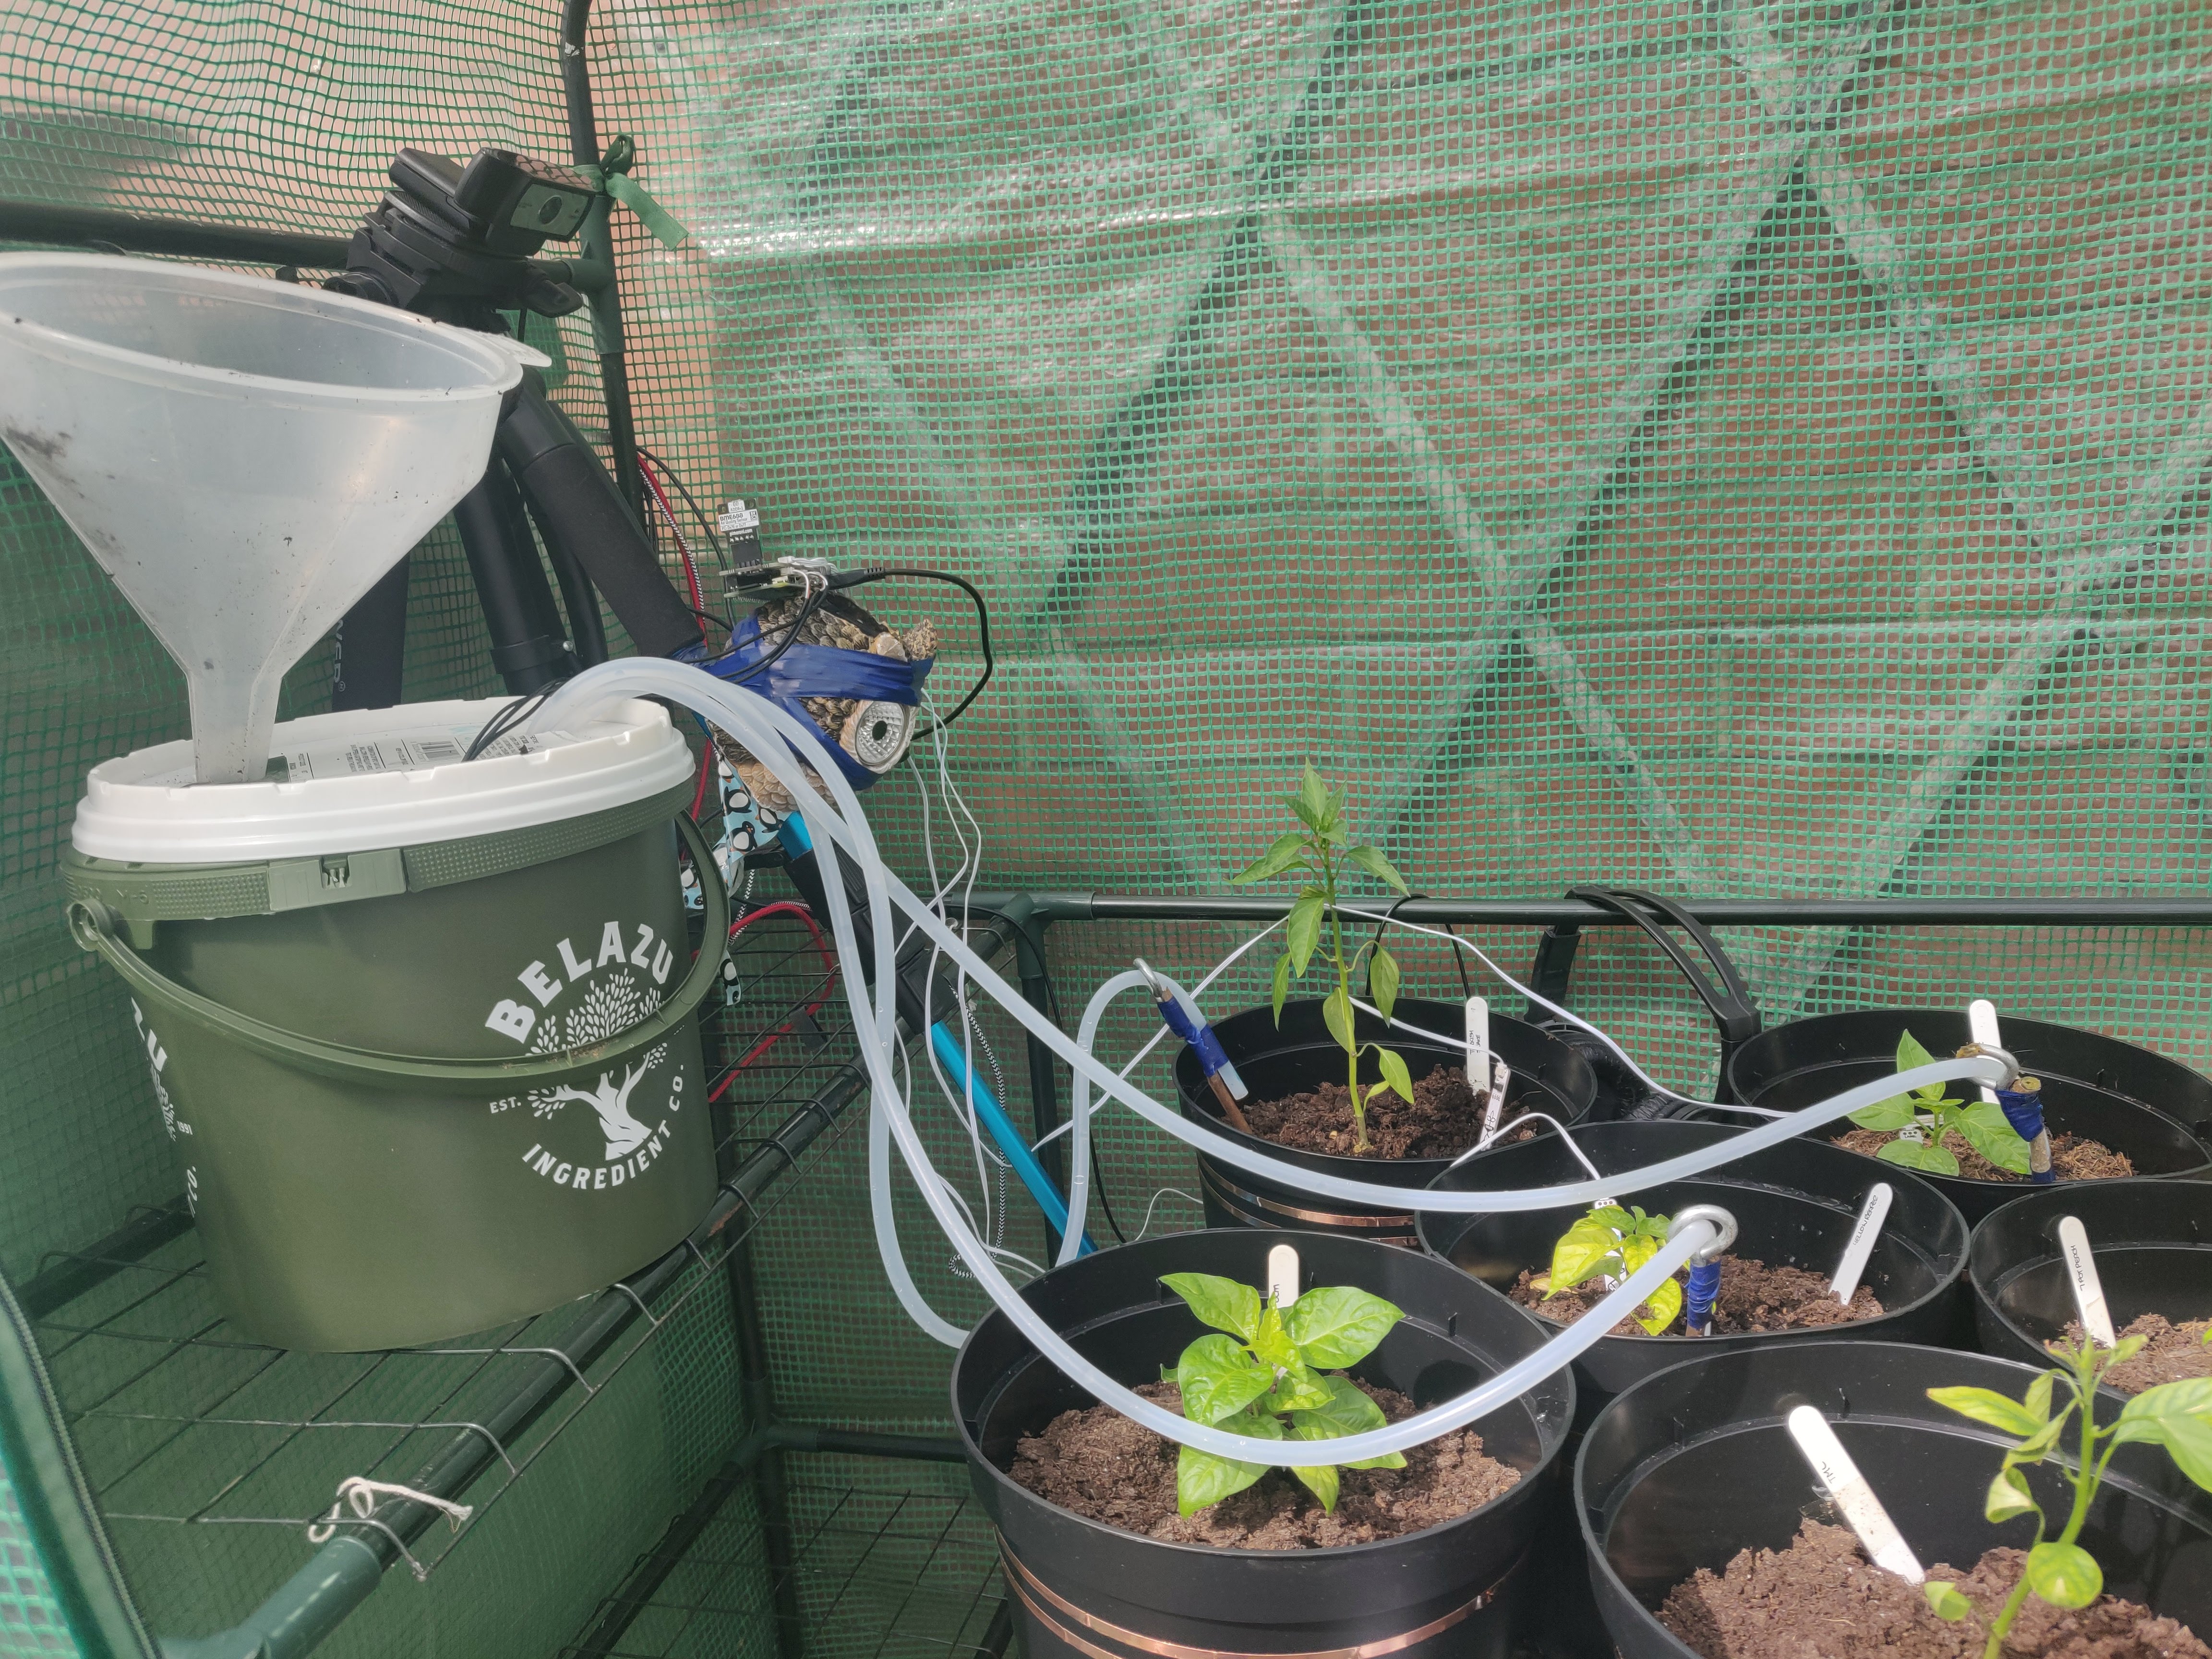
This year I’ve combined the two hobbies, and used it as an excuse to have a play with the Pimoroni GROW kit, a breakout board for the Raspberry Pi which does soil moisture monitoring and can do automatic watering. With thanks to John and another chum, I got my hands on a pair of Pi Zeros (blasted global chip shortage, they are rare as hens teeth right now.) I ended up using two, a Zero and a ZeroW2 because I struggled to get the Zero to connect to my WiFi (I’ll write that up separately - fascinating Heisenbug).
There’s no “clever” programming here, other than the Pimoroni code examples (which are excellent). For hobby coding setups I try to maximise my productivity and minimise my frustration by sticking to a some taco bell tooling
What have I got going on?
There’s a few different projects in the greenhouse, sharing kit.
- Minute by minute timelapse, using an old laptop (mounted in the shed), compiling nightly videos and mosaic images
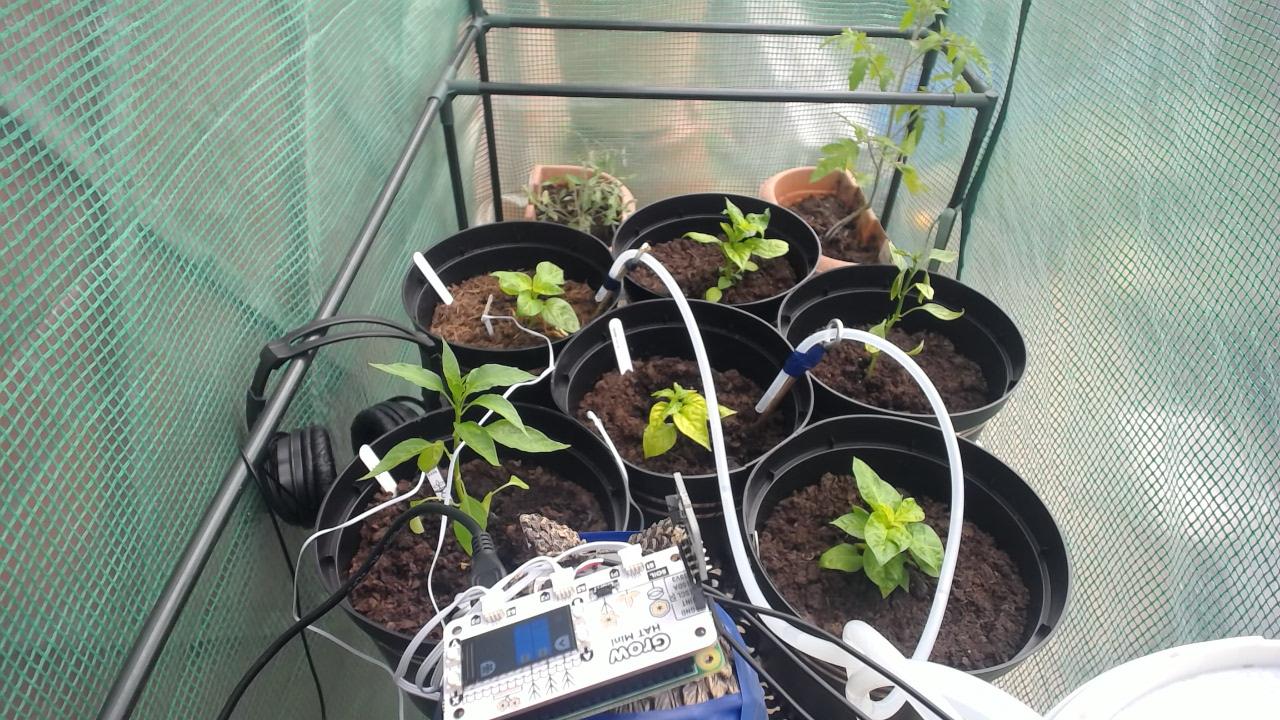
- Soil moisture monitoring and auto-watering, using a Pi Zero and Pimoroni GROW kit
- Temperature and humidity monitoring using a BME688 4-in-1 monitoring board also from Pimoroni. This board is attached to the Pi, but the graphs are rendered on the laptop and overlayed onto the timelapse photos
- 24/7 Mozart being played to the plants via an old set of loud headphones driven by the laptop
Timelapsing
The timelapse bit of this was the area I am most familiar with. Previously I used a cheap WiFi enabled security camera, accessed via http using curl and driven by BASH scripts. This uploaded to AWS for ease of backup + external access. It turns out that storing roughly 31,536,000 photos in an S3 bucket is cheap ($5 a month) but that it adds up, so this year I’m doing it all locally. I also switched from a security camera to a reasonably high end webcam (a Logitech C920 HD which was heavily discounted) connected over USB to remove another potentially fragile bit of the setup.
The timelapse kit
- Old laptop, with lightweight Ubuntu derivative Lubuntu. This is connected to the house ethernet via CAT5 coming out of the window and power from an external plug originally meant for a fountain (there when we moved in).
- Logitech C920 webcam, connected by usb, with the cable running out from the plastic greenhouse though a hole in the seam (reinforced with ducttape)
- WebCam mounted on a tripod for ease
The timelapse code
I’ll get this up and shared on GitHub at some point, but it’s small enough to be shared here. First up there’s a cron entry to call the camera script every minute and the compilation script once a day, just after 3am. Its well past midnight to make date mangling easier. All the output goes to some disposable text files. I’ve not written a logrotate entry, I might consider sending them to syslog in the future for ease
* * * * * /home/garden/chillis/grab.sh >> /tmp/grab.txt  2>&1
11 3 * * * /home/garden/chillis/compile_yesterday.sh >> /tmp/compile.txt  2>&1
The grab.sh script…
Grabs a picture, saves it in two places, makes sure all the paths exist.
- Does some path mangling to make sure this works from a crontab entry by figuring out where the it’s sorted and saving this into DIR (another post I should write in the future, I’ve lost hours to debugging scripts that ran fine from command prompt but failed in interesting ways from cron)
- Sets up some variables for use in paths by getting the date as a formatted string, DIR_DATE (example: 2022_05_18) and PIC_DATE (example 2022_05_18_11_32)
- Makes sure the directory we’re storing today’s files in exists (the or true means we don’t kick ut despite setting -e in the first line)
- Calls fswebcam, which is excellent, using Video4Linux2 device drivers. This lets me Delay 2 seconds (helps make sure the camera is online) and Skip 20 frames (helps the brightness and contrast settle down). I don’t have a title or timestamp on the picture (I used to use timestamps but then make for an ugly timelapse). Lastly it saves the file into it’s final destination
- The last line copies the image back to “latest.jpg” for ease of debugging and giving me a stable path to hit in a morning to make sure everything didn’t die over night.
#!/bin/bash -eu
export DIR="$( cd "$( dirname "${BASH_SOURCE[0]}" )" >/dev/null && pwd )"
export DIR_DATE=$(date +%Y_%m_%d)
export PIC_DATE=$(date +%Y_%m_%d_%H_%M)
mkdir ${DIR}/${DIR_DATE}/ || true
fswebcam --device V4L2:/dev/video2 -D 2 -S 20 --resolution 1280x720 --frames 1 --delay 1 --no-banner --no-timestamp  --save ${DIR}/${DIR_DATE}/$PIC_DATE.jpg
cp ${DIR}/${DIR_DATE}/$PIC_DATE.jpg ${DIR}/latest.jpg
The compile scripts…
Figures out what the date way yesterday and uses FFMpeg to compile a 1 minute video in mp4 format and a tiled mosaic image
The only interesting bits here really are related to creating the tiled image.
- scale=120:-1 means “scale all these images to 120 pixels wide, maintaining the aspect ratio”
- tile=48x30 comes from the factors of 1440 (minutes in a day thus total photos) with the most pleasing ratio (1.6:1 in this case)
#!/bin/bash -ue
export DIR="$( cd "$( dirname "${BASH_SOURCE[0]}" )" >/dev/null && pwd )"
#source ${DIR}/.creds
export DIR_DATE=$(date +%Y_%m_%d --date "yesterday")
# 24 frames a second + 1 photo every minute = video is 1 minute long
ffmpeg -r:v 24 -pattern_type glob -i "${DIR}/${DIR_DATE}/2*.jpg" -codec:v libx264 -preset veryslow -pix_fmt yuv420p  -crf 28  -an ${DIR}/rendered/${DIR_DATE}.mp4
ffmpeg -pattern_type glob -i "${DIR}/${DIR_DATE}/2*.jpg" -filter_complex scale=120:-1,tile=48x30 ${DIR}/rendered/${DIR_DATE}_complete.jpg
(Video is dark for the first 3rd because it’s night time)
Watering kit
The Pimoroni kit was on offer (yes, I am that tight), including all the pumps and piping, so I bought enough to monitor and water 3 of my plants. Yes, I have 6 plants, yes I know this is foolish. Next time…
- The Pi is powered by an old phone charger (not recommended, you generally need a bit more power than this). I had a really long USB cable I could reuse so the powerbrick stays in the shed and only the low voltage stuff needs to go into the moist greenhouse.
- The pumps are submerged in a lightblocking bucket to stop algee. It’s actually an old olive bucket from Belazu.
The GROW code for autowatering
I’ve made no updates to the code that comes with the kit (yet) and the instructions worked perfectly. I will eventually make some changes to it to log the saturation values to disk so I can graph those too.
Pi changes for ease of management
One change I did make was to make sure the syslogs of the Pi were flowing to the shed based laptop. This involves tweaking rsyslog on both ends.
On the Pi I added the following line to the end of /etc/rsyslog.conf *.* @@192.168.0.10:514 (this is the internal IP address of the laptop) and then execute sudo service syslog syslog restart
On the laptop end I needed to enable inbound syslogs from other systems by uncommenting the following lines in /etc/rsyslog.conf and then restarting it as above.
# provides UDP syslog reception
module(load="imudp")
input(type="imudp" port="514")

# provides TCP syslog reception
module(load="imtcp")
input(type="imtcp" port="514")
Lastly I setup a free account with Papertrail, a product I’ve used for years and which is now owned by my former employers. This means I can check logs from my phone over a web API and setup to-email alerts for keys phrases (such as “watering”).
To enable sending logs to Papertrail I didn’t install the app but added the following (redacted) line to /etc/rsyslog.conf on the laptop *.* @[redacted].papertrailapp.com:[redacted]
Webserver for easy access
Historically I’ve generally pushed and pulled files around with scp and keys for authorisation. This works just fine, and is very command line scriptable, but this time I decided to throw Nginx up on each machine invovled and surface the files I wanted to share (pictures, data files etc) that way. It makes quick check debugging easier (I can see last night’s timelapse on my phone, from bed, in the morning) and it makes pushing and pulling data from one machine to the other as easy as a curl statement.
Nginx is easy to install, easy to configure and pretty light weight.
The temperature and humidity monitoring
I bought the slightly more expensive BME688 over other monitoring boards because it also included volotile gas measurement. I plan to monitor the levels of CO2 and Oxygen in the greenhouse at some point.
Getting the data out
To get the data off the board I’m calling a slight modified copy of one of the example scripts from cron and pushing the files to date names individual files .
In temperature-pressure-humidity.py I added the following lines to add a timestamp to the beginning of each line it prints and swapped commas for spaces, to make processing in GNUPlot later easier.
First, calculating the number of seconds that have passed today, to give me a nice x-axis from 0 to 86400
now = datetime.now()
hours = int(now.strftime("%H"))
minutes = int(now.strftime("%M"))
seconds_today = (3600*hours)+(60*minutes)
(Yes, this code is ugly and inefficient, but I can read it super easily when tired or after 3 years)
Then I tweaked the print statement to include this value
if sensor.get_sensor_data():
        output = '{0} {1:.2f} {2:.2f} {3:.3f}'.format(
        seconds_today,
        sensor.data.temperature,
        sensor.data.humidity,
        sensor.data.pressure)
        print(output)
This Python script is called by a BASG script that’s called every minute from cron * * * * * /home/pi/monitoring/grab-stats.sh > /dev/null 2>&1
grab-stats.sh is a very simple script which just manages file locations and names.
#!/bin/bash -eu
export DIR="$( cd "$( dirname "${BASH_SOURCE[0]}" )" >/dev/null && pwd )"
export STAT_DATE=$(date +%Y_%m_%d)
${DIR}/temperature-pressure-humidity.py >> ${DIR}/${STAT_DATE}.txt
tail -1 ${DIR}/${STAT_DATE}.txt > ${DIR}/latest.txt
The last line tail -1 ${DIR}/${STAT_DATE}.txt > ${DIR}/latest.txt is a quick and dirty way of making sure the latest set of results is available in a known location without having the write the file twice.
Why is this a cron calling a BASH script, calling a Python script, and then using tail? Because it’s Taco Bell all the way, simple tools, glued together in very debuggale ways. Sure, I could have written a Python script that does all of this and is wrapped in a service definition, and I probably will, but for 15 minutes work on a Saturday morning before I head out, I use what I know.
Graphing the data
This was new to me, and I first experimented with some Python graphing code I used to make XKCD style graphs on another project, something I might go back to, however, to I wanted to get a transparent PNG I could overlay onto the timelapse pictures in the style of a sparkline graph, so I installed GNUPlot and in an hour or so had something I liked the look of.
Once again, cron and bash are my hammers of choice. There’s a separate cron entry for calling the graphing stuff so that it’s independant of all the other things going on. More on why later.
cron entry is simple * * * * * /home/garden/chillis/graph.sh >> /tmp/graph.txt 2>&1 calling the script every minute and throwing the output to a tmp file.
graph.sh is a bit more complex
- the usual date mangling
- sleeping for 10 seconds to make sure that anything else that happens every minute has completed (dirty, needs rethinking)
- Pulling the data file from the Pi, over the internal network, with the file name being based on the date
- Making sure the output directory is there
- Calling gnuplot and piping in my graph definition file (see below)
- Moving files around so I can get them
- Creating a composite image (more later)
#!/bin/bash -eu
export DIR="$( cd "$( dirname "${BASH_SOURCE[0]}" )" >/dev/null && pwd )"
export DIR_DATE=$(date +%Y_%m_%d)
export PIC_DATE=$(date +%Y_%m_%d_%H_%M)
sleep 10
curl -o ${DIR}/data.dat http://192.168.0.210/${DIR_DATE}.txt
mkdir ${DIR}/${DIR_DATE}/ || true
gnuplot < ${DIR}/temp-hum.plot
cp ${DIR}/lastest_graph.png ${DIR}/${DIR_DATE}/graph_$PIC_DATE.png
/usr/bin/gm composite -geometry +0+420 ${DIR}/lastest_graph.png ${DIR}/latest.jpg ${DIR}/${DIR_DATE}/datagraph_$PIC_DATE.jpg
cp ${DIR}/${DIR_DATE}/datagraph_$PIC_DATE.jpg ${DIR}/latest-graph.jpg
temp-hum.plot (Temperature and Humidity) is simple enough but took a bit of experimentation to get to something usable, forcing a transparent background (“transparent truecolor”), no axis or border, the image size being the same width as my timelpase camera pictures and finally making the x axis run from 0 (midnight) to 86400 (the number of seconds in a day). Irritatingly I’ve had to add some hardcoded paths in there just to make my life easier, I’ll remove those at some point.
set terminal png size 1280,100 transparent truecolor enhanced font "Helvetica,12"
set output '/home/garden/chillis/lastest_graph.png'
unset xtics
unset ytics
unset border
set xrange [0:86400]
plot for [col = 2:3] "/home/garden/chillis/data.dat" using 1:col with linespoint notitle
Compiling it all together
Now that I’ve got two images, latest.jpg from the camera and lastest_graph.png for the data, it’s easy enough to combine them.
I could have done this with FFMpeg which is already installed, and I might swap it out at some point, but I find it’s syntax endlessly confusing and so I ended up installing GraphicsMagick which is an alternative to the excellent ImageMagick. The following line says “compose these two images, and offset the first one by 0 pixels on x and 420 pixels y”
/usr/bin/gm composite -geometry +0+420 ${DIR}/lastest_graph.png ${DIR}/latest.jpg ${DIR}/${DIR_DATE}/datagraph_$PIC_DATE.jpg
These images are then compiled nightly using FFMpeg to a separate file, so that I have timelapses with and without data
(Video is dark for the first 3rd because it’s night time)
24/7 Mozart
This is such a silly thing, but it entertains me. MythBusters has a piece on does music affect how well plants grow and it seemed to be positive, so why not just throw something in there and see. I didn’t want to distub my neighbors, so it had to be quiet enough to not leak out of the plastic greenhouse too much, so I attached an old pair of (over loud) headphones to the laptop, ran the cable though and then piped a piece of rights free music in (thanks to Internet Archive for the mp3.)
nohup means it keeps running after my session disconnects, cvlc is the commandline tool for the most excellent VLC
nohup cvlc --loop mozart.mp3 &
What’s next
Nothing really. I’ll enjoy watching my plants for the rest of the summer, making a few timelapses and maybe tweak the setup a bit. I was pleasently surprised at how easy getting the BME688 up and running was, I might experiment with that some more.